Feeds:
Posts
Comments

Posts Tagged ‘Market’

Why market mass selloff?

In general, market always goes up because people are working hard and business and industry support a lot of innovations to compete each others locally or globally. Nobody wants market to go down that is why our world is developing so much compared to the last century.

However, market frequently goes down due to

1. Mismanagement in politics.

2. Mismanagement in financial institution including banks, federal reserve, and credit rating agencies.

3. Mismanagement in business likes Lehman brothers.

4. Fraud in business likes Bear stearns.

5. Systematic manipulation by the greedy company such as greedy hedge fund.

6. Lack of required regulations.

7. Excessive regulations.
Dodd–Frank Wall Street Reform and Consumer Protection Act stabilizes the market initially. However, business can’t growth in America because of that law. In fact business have to move elsewhere that generate more unemployment. For example, Apple have many great innovation recently however they manufacture the innovative  product in Japan, the Philippines and China. Excessive regulations has made it too expensive to manufacture anything domestically.

8. More liberal agencies on excessive spending.

9. Unnecessary war like Libya.
Cost of Libya Intervention $600 Million for First Week, Pentagon Says

10. Excessive spending for majority of people to get votes

In fact, the combination of trigger needs to have sell off.

1. Combination of negative news such as Europe credit problems, US debt problems, S&P credit downgrade news.
Coming up: more bad news on Student loan debt grows, Consumer Credit Card Debt grows and so on.

2. Most of the TV station needs high rating in order to survive in the market. In fact, they like more bad news because bad news get more attention for viewers. That is also true for periodicals and comedians. In fact, they try to fire more bad news and bad news comment as well as bad speculations. Actually, they are no more than greedy businesses.

In this August selloff, US Public Pension Funds Lose Billions. According to the Huffingtonpost

  • California’s main public-employee pension fund, the nation’s largest, has lost at least $18 billion off
  • Florida’s pension fund has lost about $9 billion since June 30
  • Kentucky, which has more than $20 billion in unfunded pension liabilities

Actually, those losses are penny compared to the Rich lost.

That is known as FEAR not normal market correction however this processes will be happened again and again. Selloff is de-risking from the market due to uncertainty. However, after Selloff, investors face another risk called currency risk because US dollar is fallen apart. In fact, most of the assets transform to Gold and US treasury which was just downgraded to AA+.
Read Full Post »

The Dow Jones industrial average was down more than 500 points on August 8, 2011. Its bear market time for both Equity and Commodity.

All average down as follows (August 8, 2011):

US Market

DOW JONES INDUS. AVG 11,383.70 -512.76 -4.31%
S&P 500 INDEX 1,200.07 – 60.27 -4.78%
NASDAQ COMPOSITE INDEX 2,556.39 -136.68 -5.08%
AVERAGE -4.7%

In terms of lost, the drop trimmed about $800 billion(Total point down – 709.71), as measured by the Wilshire 5000 Total Market Index.

European Market

FTSE 100 INDEX 5,393.14 -191.37 -3.43%
CAC 40 INDEX 3,320.35 -134.59 -3.90%
DAX INDEX 6,414.76 -225.83 -3.40%
AVERAGE -3.57%

(CLOSED BEFORE DOW SINK TO 500 POINTS)

Asia-Pacific Market

NIKKEI 225 9,318.65 -340.53 -3.53%
HANG SENG INDEX 20,844.60 -1,040.15 -4.75%
S&P/ASX 200 INDEX 4,108.70 -167.80 -3.92%
AVERAGE -4.06%

(STILL TRADING on August 9th) [Ref:http://www.bloomberg.com/markets/stocks/world-indexes/%5D

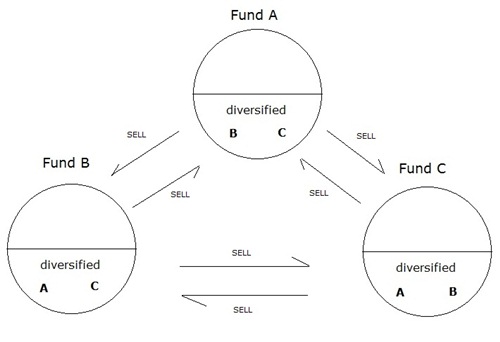
Due to some unpleasant triggers (that can be speculated by so called experts), Fund or index A sell the equity. As a consequence, the program automatically sell Fund B and C. The similar is true for Fund B and C as well as shown in figure. Imagines millions of diversified funds sell each other globally within a second. As a result we have a downfall on Equity trading. That downfall on Equity trading can be stopped by one good news for the next cycle.

If there are more bad news instead of good news in the following day, there will be more downfall. If there is no intervention by any means, the Equity will be plunged. In fact, it’s similar to Domino Action. Now, we are waiting for the last Domino chip to resist the sell-off.  Bank Interventions may be somewhat related to the market interaction.

The similar is also true for reverse interaction. One good news trigger buy signal and the consequence will follow.

It is the effect of IT globalization or diversification in Equity market. If downfall continue, there is no safe haven exist even Gold price can be dropped as seen on August 8th sell-off.

FUND-TO-FUND RELATION

Circle of Fear

Then, the market becomes over sold as a result of sell-off, the opportunity to buy the market again. Of course, the risk and reward always exist that is why we have rich and poor do exist.

List of Speculation:

1. US Debt Ceiling Debate. [Actually it was over long time ago]

2. U.S. economic data has worsened. [That is also not news since President Obama took office]

3. Investors there are worried about increasing debt problems in Italy and Spain. [That also exist for a long time ago, not yesterday]

4. Some investors also were selling to protect their portfolios before Friday’s monthly announcement of unemployment data. [That is a speculation. What if unemployment data goes down a bit]
(http://www.yousaytoo.com/dow-jones-today-august-4-2011-down-more-than-400-points/952895)

5. News on the rating downgraded by Moody’s and others.

6. Bank Intervention by Swiss, Japan and BOA instead of central banks monetary easing policy.

7. Concern on the CBOE’s fear indicator

8. U.S. Consumer Confidence Drops to Minus 47.6 in Bloomberg Index on Economy. [Ref:http://www.bloomberg.com/news/2011-08-04/u-s-consumer-confidence-drops-to-minus-47-6-in-bloomberg-index-on-economy.html%5D

9. US Economic Uncertainty.

10. All of the above.

Read Full Post »

Is Dow Jones Index really increasing? Think twice.

Today, Dow Jones Index is really increasing for no-brainers. That is why no-brainers don’t understand why unemployment rate is still high in US regardless of Dow Jones Index increasing(based on US$).

The Dow Jones Index for 5 years Graph is as follow,

value of the DJIA

where p are the prices of the component stocks and d is the Dow Divisor.
(Ref: http://en.wikipedia.org/wiki/Dow_Jones_Industrial_Average)

and, the price of Gold for 5 years Graph is also as follow,

We can compare above two graphs for the each relative index, we have a surprising graph.

Relative Index for Dow vs Gold

In fact, the real value of Dow Jones Index based on historical Gold Prices is decreasing that no-brainers are not able to understand. Moreover, no-brainers are not able to understand why US unemployment rate is so high even tho current Dow Jones Index based on US$ is increasing. When re-draw the graph, Relative Dow Jones Index based on Gold Prices vs Relative US Unemployement Rate Graph(Ref: http://www.miseryindex.us/urbymonth.asp),

Unemployement-and-Dow-Gold

We can clearly see the reverse correlation.

Read Full Post »

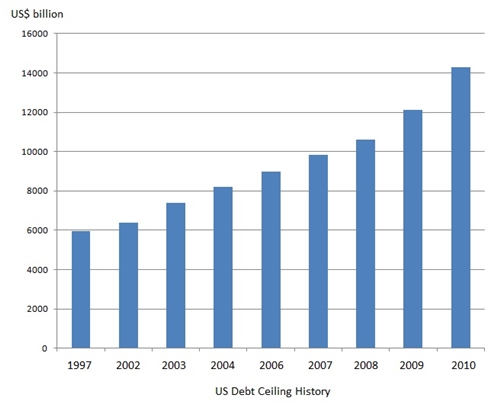
US Debt ceiling is increasing significantly based on the history of US debt history data. (Ref: http://fpc.state.gov/documents/organization/105193.pdf). In fact, it is really alarming for ordinary people as well as politician both democrat and republican in USA. As mentioned by Federal Reserve Chairman Ben S. Bernanke on Thursday, it’s just a political issue not an economic issue. so WHY?

US Debt Ceiling History

At this point,we don’t even taking into account in inflation issue. In fact, we should bring this issue on global gold price which is a good indicator of monetary inflation. The graph of 15 year gold price history in US Dollars per ounce shown below. (Ref: http://goldprice.org/gold-price-history.html)

15 year gold price history in US Dollars per ounce (goldprice.org)

In fact, when we redraw a US debt ceiling graph in term of gold price, we have the following amazing results,

US Debt Ceiling in term of Gold Price

As shown in figure, actual US Debt ceiling is decreasing in term of Gold.

As a matter of fact, its indeed, US is able to increase their debt ceiling to as high as 32 trillion US$ (based on the current gold price of 1500+ US$/ounce) which is the same as 2002 real debt ceiling based on the gold price at that time. If one can predict the Gold price for 2,000 US$/ounce for the next couple of years, the suitable US Debt ceiling should be 42 trillion US$ . Wow.

In fact, all rating agencies such as Moody’s Investors Service, Standard & Poor’s and Fitch Ratings should grand US to not only AAA but also AAAAA because real debt ceiling is getting lower based on the Gold price.

As a matter of fact, Debt ceiling issue is a political not an economic! Federal Reserve Chairman Ben S. Bernanke is really a genius.

Read Full Post »

Before economic crisis, Dow Jones Industrial Average was about 14,000 (according to the figure below), now the average is about 12,446 as of July 2011. If we are financial idiot, we can say that US economy is already recovered. We will really have to thank President Obama and his Democratic Party Administration for this regard. However they never mention the US economic recovery because Dow index is just an artificial.

If Dow really has a real index, the un-employment rate of US should have to be in good shape nowadays. The US unemployment rate is not reducing since famous economic crisis 2008. As a result, the revenue shortfall in Federal Reserve as well as all state governments.

We wonder why that means.

Here is a process of potential crash!

US Government prints more Buck.
Buck goes to Equity market worldwide.
Finally Buck arrives to Company A.
Instead of spending more jobs for Company A, they buy more Equity with leverage.
More Buck goes to Equity market worldwide again.
Finally Buck arrives to another Company B.
Instead of spending more jobs for Company B, they buy more Equity with leverage.
and goes on and on.
In fact, Equity market has a growing big bubble due to leverage trading.
After increasing US Debt ceiling.

Photo Credit: http://www.usatoday.com/

US Government will prints more and more and more Buck again and again.
In fact, Dow and world indexes bubble will be growing again. Guess what will happen next!

According to the US Housing Prices Trend see below figure, the current unemployment rate is direct correlation with the current US Housing Prices Trend not Dow Index. It confirms that, Dow index is just an artificial.

Read Full Post »

In general, the current price is set by the equilibrium point of the supply and demand. This concert started in many years ago since mankind started trade and we are still learning this concert in the school. It’s seen perfect for the old ages.

The same concept is also true that artificial supply and artificial demand can create the new artificial prices nowadays because artificial supply and artificial demand are created by the artificial customers. Sometimes known as computer, laptop, blackberry, iPhone, hedge fund and ETF. Those are the by-product of greedy capitalism. Those are existed whether you like it or not. The only rule in this world is the winner takes all.

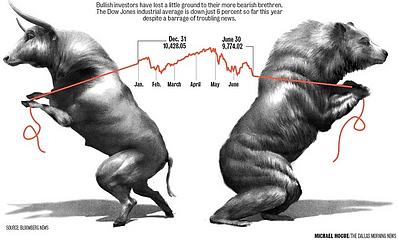
Big Bull and Big Bear

Photo Credit - bigbullandbigbear.blogspot.com

In fact, artificial customers play key role in the current trade in this world. The current trade model is based on the news(both financial and political) and speculations. It doesn’t matter the news and speculation are true or not because they already traded ahead of that instance. When the news and speculation are not true the price will be re-adjusted to some point again but at the previous level. In fact, the likeable price doesn’t exist today.

In old age, the information technology doesn’t exist. Moreover there is no leverage in trading.

Today many traders have iPad in their hand and bank gives them more than leverage 50 or 5000%. Let’s do the simple maths. Leverage is the one of the main profit for the bank.

Old age: 1 customer : 1 leverage
New age: 1 computer : 50 leverage

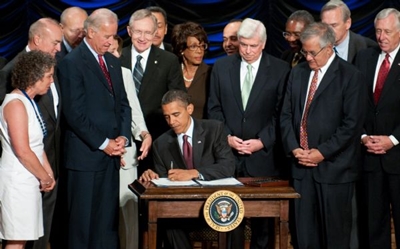
How about 100 million computers? 5 billion leverage or 500 billion %. It’s quite significant number. It’s our big brother, known as artificial Big Bull or Big Bear. Before Dodd-Frank Wall Street Reform and Consumer Protection Act that will be triggered on July 14, the leverage can be as high as 300 to 500 compare to leverage limit 50. Moreover, Gold trading for American trader with leverage is out of the question.

Dodd-Frank Wall Street Reform and Consumer Protection Act

Dodd-Frank Wall Street Reform and Consumer Protection Act

It’s a government intervention on trade. Live with that whether we like it or not.

In conclusion, please don’t blame on the current price volatility because almost all traders are not human anymore it’s IT, a creator or destroyer of the world trade.

Read Full Post »

Most of the genius thinks about the fundamental. Talk about the fundamental. Learn about the fundamental. If you don’t talk about the fundamental, they will treat you like an idiot.

Actually fundamental comes from the statistical conclusion of the technical analysis which is mathematical interpretation of many economic data.

What’s wrong with fundamental? There is nothing wrong with fundamental.

The current price of the particular product such as currency, equity, commodity, or whatever is based on the equilibrium point of the supply and demand. That we had learned in the school. In fact, all genius trade in the same direction and more genius said that is the tread that you must follow.

In general, you should follow the tread at the start but who know that is the correct trend. Actually, all genius guesses the trend. If their guess is correct, they become one of the great gurus that can be seen on CNBC daily. Actually their prediction won’t last long for 12 hours. My perspective is that it is the start of the bubble.

Remember, bubble does burst all the time. It’s the opportunity to beat the market.

Read Full Post »